
Mechanic Guides
Automotive Multimeter Duty Cycle vs Frequency: Keep Hz and Percent Separate
Interpret automotive meter Hz and duty-cycle readings with the correct polarity, test point and operating context. Includes a paired measurement record.
Published · 5 min read
Quick answer
Frequency counts cycles per second; duty cycle describes the selected portion of each period. Record Hz, percent and the meter’s high-time or low-time convention. Complementary percentages can describe the same waveform and do not by themselves establish a circuit fault.
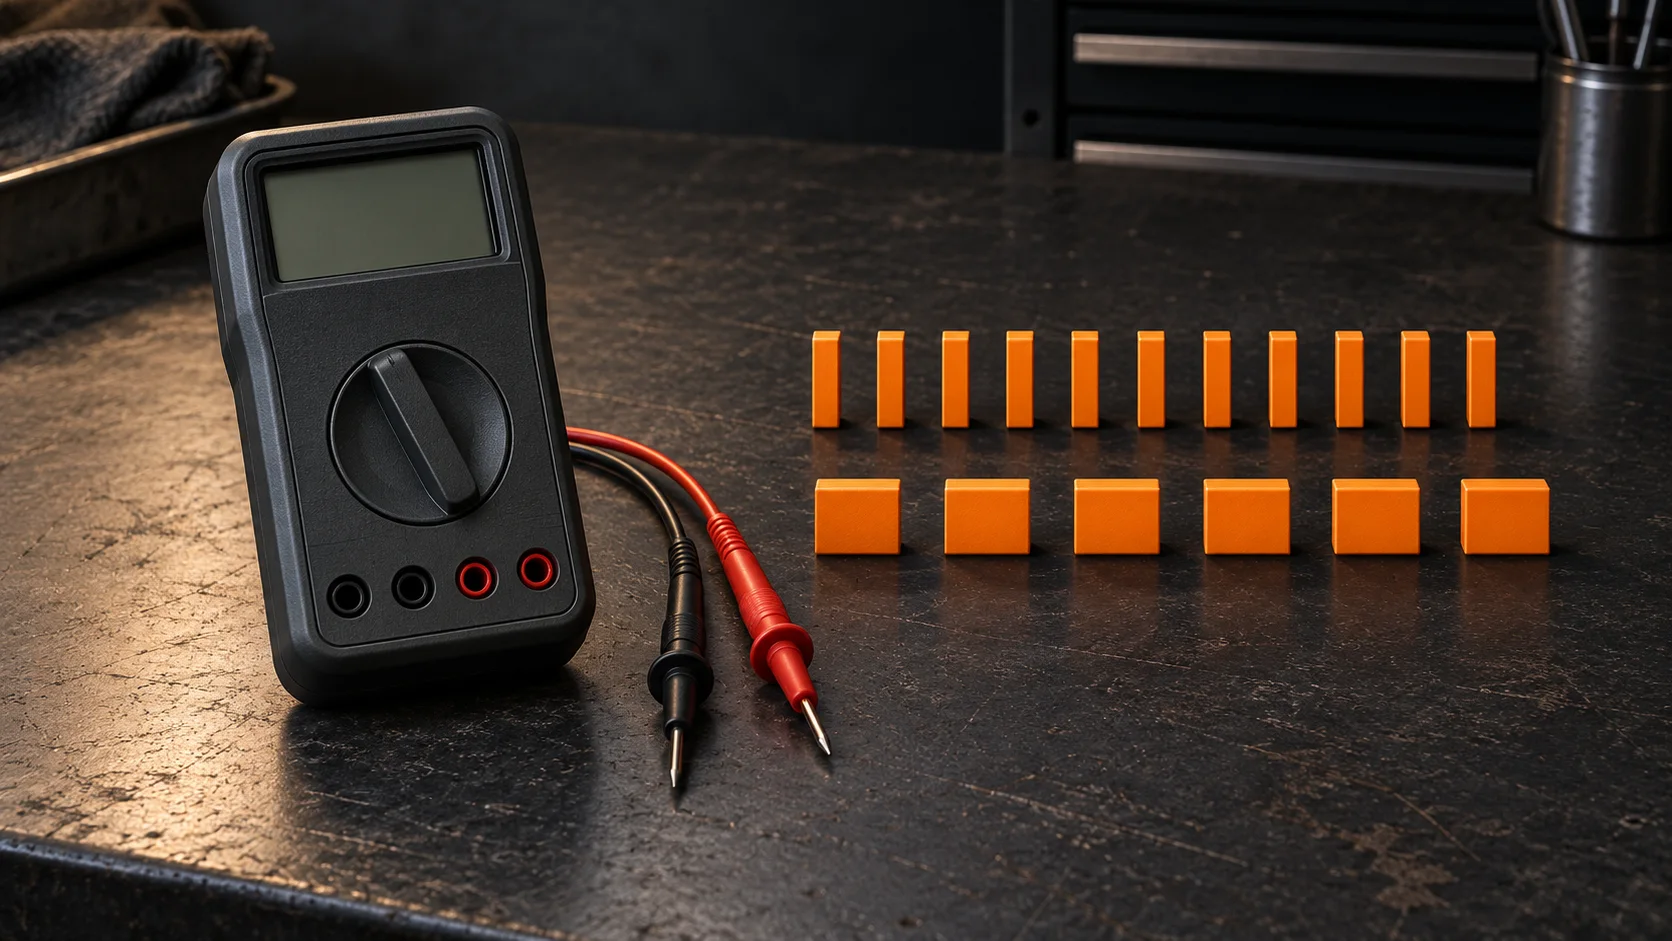
Frequency tells you how often a signal repeats. Duty cycle tells you what fraction of each period meets the selected high or low condition. Record both, along with the meter's polarity convention, before deciding that a control signal disagrees with service information.
Start with the quantity the procedure requests
A frequency reading uses hertz: cycles per second. A duty-cycle reading uses percent of a complete period. Pulse width is a duration. These quantities describe different aspects of a repeating signal and cannot be substituted just because the meter uses the same button to select them.
For a fictional ideal waveform, one cycle lasting 10 milliseconds repeats 100 times per second, or 100 Hz. A high interval of 3 milliseconds occupies 30% of that period. The remaining low interval occupies 70%. The arithmetic is illustrative; these are not expected values for any vehicle circuit.
A test calling for frequency is not completed by recording only 30%. A test calling for high-time percentage is not completed by recording only 100 Hz. Label the units in the repair order rather than writing an unexplained number.
A complementary percentage can be a setup difference
A duty-cycle meter identifies a signal relative to its trigger threshold. Depending on its selected slope or polarity convention, it reports time above or below that threshold. Consult the exact meter instructions to identify the selected mode; button sequences and display symbols are not universal.
In the ideal example, 30% high time and 70% low time describe the same waveform. Two technicians can therefore report different percentages without the circuit having changed. Confirm the test point, reference, operating condition and selected convention before treating that difference as a fault.
Do not assume that high voltage always means the component is on. The circuit's control arrangement determines how the measured voltage relates to operation. Use the wiring information and prescribed test point to interpret the measurement. A label such as duty cycle on a scan tool also needs its own definition before it is compared with a meter reading.
Check whether this meter can answer the question
Confirm that the selected function supports the signal's frequency and level, using the meter's published limits. Follow the vehicle procedure for connections and operating conditions. The presence of an Hz or percent button does not make every circuit an appropriate test point.
If a reading is absent or unstable, record that observation and check the setup. Do not turn an unsuccessful measurement into a confident zero-duty or no-signal diagnosis. If the question concerns pulse shape or individual events, use a suitable waveform capture and interpret it with the necessary context. A single percentage is a summary, not a record of every transition.
Keep voltage, frequency and percentage separate in the notes. A voltage-mode result is not itself a duty-cycle result. Avoid converting one into the other without a justified signal model and a procedure that supports that interpretation.
Use a paired measurement record
For each observation, preserve enough information to reproduce what the meter measured:
- Vehicle, circuit and exact test point.
- Instrument model, function and measurement reference.
- Operating condition and whether the complaint occurred.
- Frequency in Hz and duty cycle in percent.
- Selected high-time or low-time convention, as defined by the meter.
- Relevant service-information expectation and its definition.
- Setup limitations, unresolved discrepancies and the next test.
Fictional handoff example: one technician records 30% and another records 70% under the same stated conditions. Instead of replacing the actuator, they compare settings and discover that one recorded high time and the other low time. They repeat the prescribed measurement with the same convention and update the record. Agreement removes that particular reporting discrepancy; it does not by itself prove the actuator works correctly.
Separate a signal observation from a repair conclusion
A repeatable percentage is useful evidence when its meaning is clear. Keep the conclusion proportional to the test: what was measured, under which conditions, and what remains unresolved. Use the diagnostic report template to carry those distinctions into the handoff.
Download the paired measurement record above before the next comparison. STEP is in Early Access. Request early access to discuss how your shop organizes diagnostic evidence and next tests. This guide does not imply automatic meter integration or interpretation by STEP.