
Mechanic Guides
Infrared Thermometer Distance to Spot Ratio: Check What Fits in the Reading
Compare your instrument's spot-size diagram at the actual viewing distance with the target's narrowest clear width. Leave room for aiming variation and check emissivity separately before accepting a temperature comparison.
Published · 4 min read
Quick answer
Compare your instrument's spot-size diagram at the actual viewing distance with the target's narrowest clear width. Leave room for aiming variation and check emissivity separately before accepting a temperature comparison.
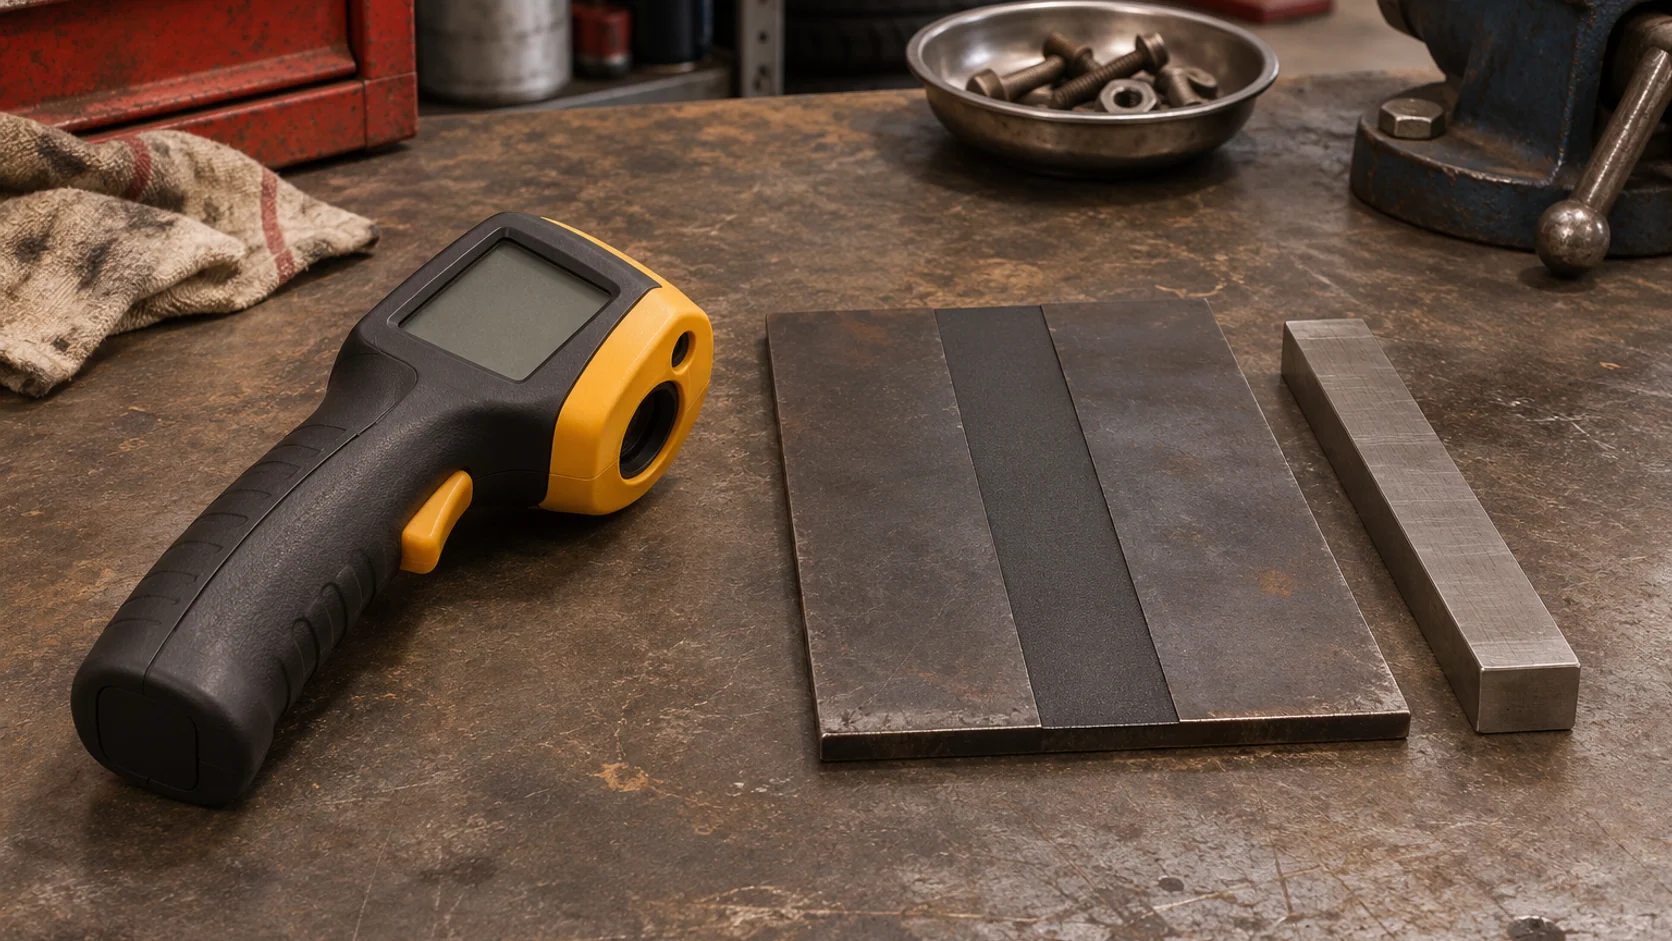
An infrared thermometer can put its aiming dot on a narrow band of a housing while the sensor also sees the material beside it. The reading can stay steady and still describe a larger area than the one named on the job record. Check the optical footprint before using two temperatures to compare parts.
Read the spot diagram at the distance you can actually use
Distance to spot ratio, often written D:S, describes the relationship between viewing distance and the approximate diameter of the measured area. Fluke's guide uses a 12:1 example to explain why a small target can pick up surrounding temperatures when viewed from too far away. Use the diagram for the actual model to check its distance reference, working range and specified spot at your intended distance. A ratio alone can be an estimate, especially close to the instrument or outside the distances shown in the diagram.
Measure the uninterrupted target across its narrowest usable dimension. Exclude slots, edges and holes, and consider whether a bracket or shield crosses the view. Use the maker's guidance for target size and leave room for normal aiming variation. A footprint that barely fits on paper can include an adjacent surface when your hand moves or you must aim at an angle. If the target cannot be seen from a safe, appropriate position, use an applicable approved alternative.
Treat the aiming mark as a guide
The Fluke 56x manual describes its laser as an aiming aid separate from temperature measurement. Some dual-laser models provide more information about the footprint. For example, Klein describes the IR5's two-dot spacing as an approximation of the spot diameter. That feature belongs to the specified model. Read the instructions for the instrument on your cart before interpreting either a single dot or two dots as evidence about the area.
An optical fit check answers which area is in view. Surface finish, reflections and emissivity still affect the result. For that part of the validation, see infrared readings on shiny metal. Keep the footprint decision and the surface decision as separate entries. Changing an emissivity setting cannot remove another surface from the field of view.
Try the arithmetic before accepting the comparison
Consider a fictional stopped training assembly with a usable matte strip 0.75 in wide. The tool is labeled 12:1 and the access point is 18 in away. A simple ratio estimate gives a 1.5 in spot diameter. Even with the center on the strip, that footprint is wider than the target. Record that reading as a mixed-area observation. Use the model's diagram for any revised plan and leave a margin beyond the indicated spot size. This example illustrates geometry only and does not prescribe a safe distance or temperature limit.
The same issue can produce a misleading left-to-right comparison. One side may offer an unobstructed view and the other may force a longer or angled view. Write down the geometry on both sides before comparing the numbers. Use the applicable vehicle procedure and observe the instrument's safety instructions. Record operating state and elapsed time so differences in measurement timing stay visible.
Leave the next technician a repeatable setup
For each reading, record the exact location and finish, thermometer model and emissivity setting, distance, diagram-based spot diameter, usable width and whether the footprint had room to fit. Add the operating condition and time of measurement. If the geometry was poor, preserve the original number with that limitation and identify the measurement needed before drawing a component conclusion.
The worksheet provides a row for each side of a comparison. It keeps the observation and the reason for accepting or deferring it together. Request STEP Early Access to follow its development for professional diagnostic work.